Instacart - Online Shopping
Instacart is an online grocery store operating through an app. They want to target different customer groups with effective marketing campaigns.
-
As a data analyst, my goal was to analyse Instacart's customer and sales data to derive insights for optimal customer segmentation. This would inform marketing and sales strategies.
-
What are the busiest days of the week and hours of the day?
When do customers spend the most money?
Which departments have the highest frequency of product orders?
What different classifications does the demographic information suggest?
Are there differences in ordering habits based on customer's region, loyalty status, age, income, etc.?
-
Instacart's customer, product, and orders data. The final merged dataset contained over 32 million rows.
Instacart is a real company, but the data used here was fabricated by careerFoundry for this project.
-
Python was utilised in the Jupyter Notebook web application to perform all necessary data cleaning, wrangling, and analyses.
Project documentation (such as population flows) and insights were recorded in Excel.
-
This is a project I completed as part of the data analytics course at CareerFoundry.
Approach and Process
Data Preparation
Multiple dataframes were loaded and cleaned in Python using the Pandas library. After this, all dataframes were merged into a comprehensive dataframe for analysis.
Columns were derived using the loc function in Pandas to assist in segmenting customer purchasing habits and gemographic information.
Column datatypes were also changed to optimise storage requirements and processing speed without causing errors.
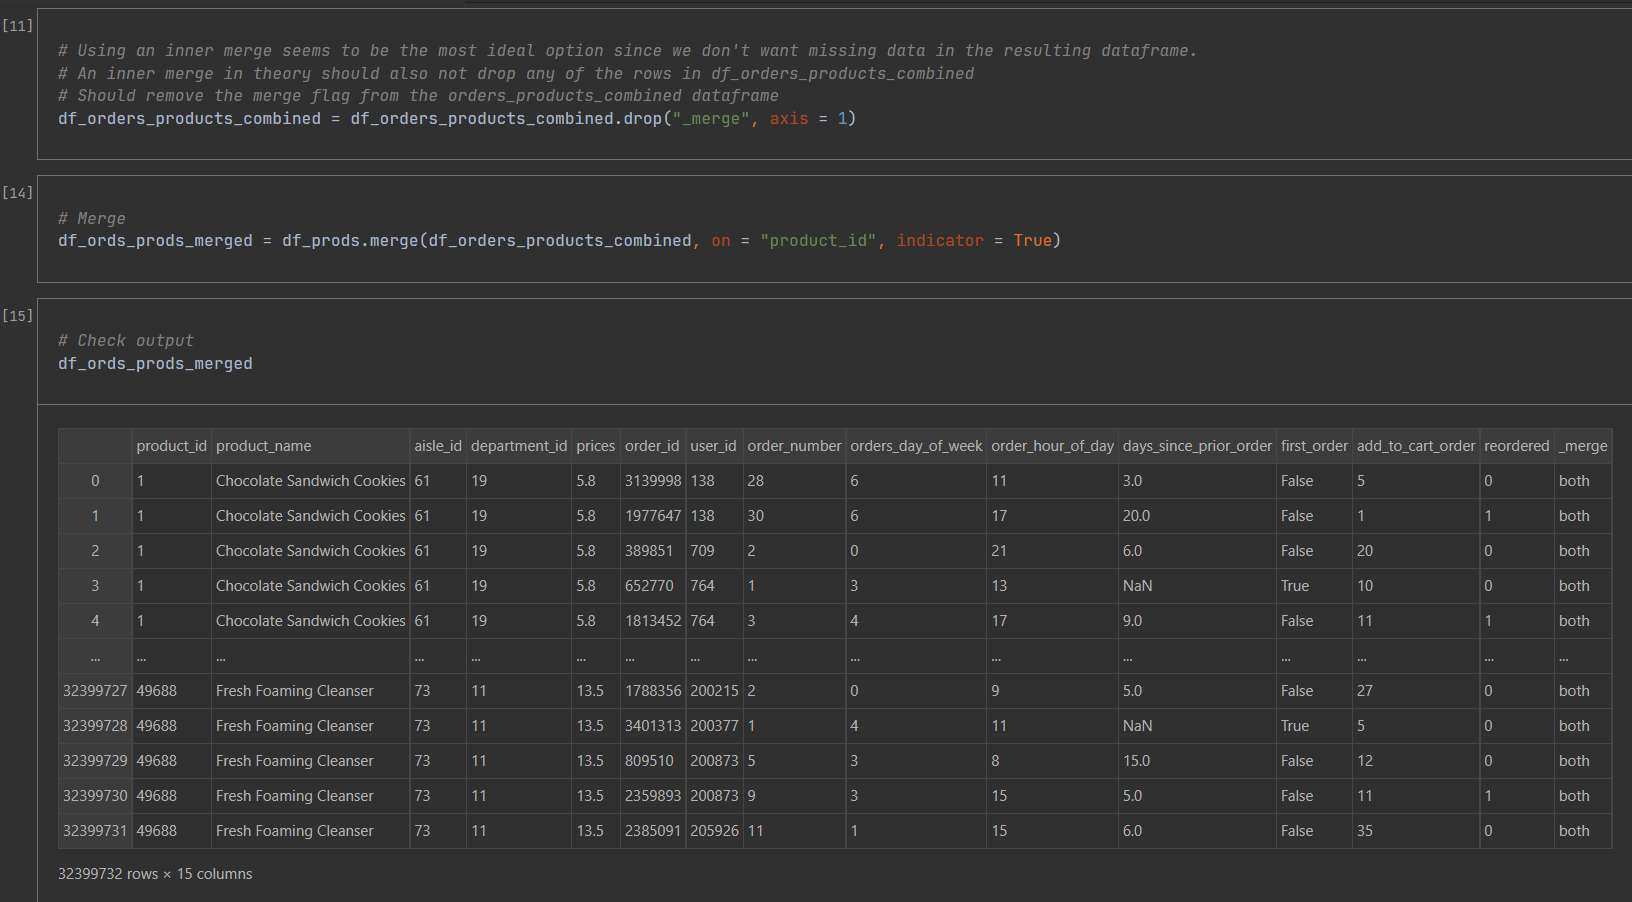
Code snippet showing inner merge of 2 datasets with checks and comments.
Data Analysis
Conducted descriptive statistics with NumPy and Pandas as part of the initial data exploration.
Constructed simple and compex visualisations using Matplotlib and Seaborn to answer business questions. I ensured that every chart and graph was easily read and understandable by writing code to affect gridlines, chart sizes, labels, colours, etc.
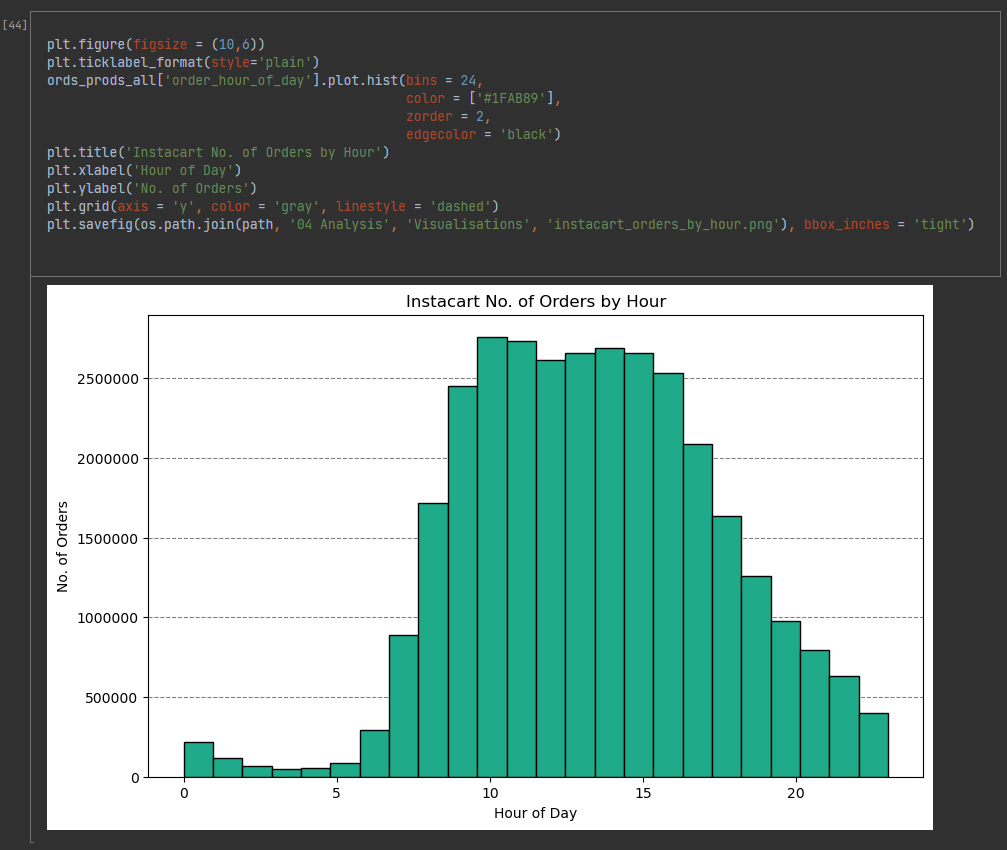
Histogram made in Python showing the most popular order times on Instacart’s app based on total orders. Peak times for Instacart are between 9am and 4pm. Fewest orders are made between midnight and about 6am.
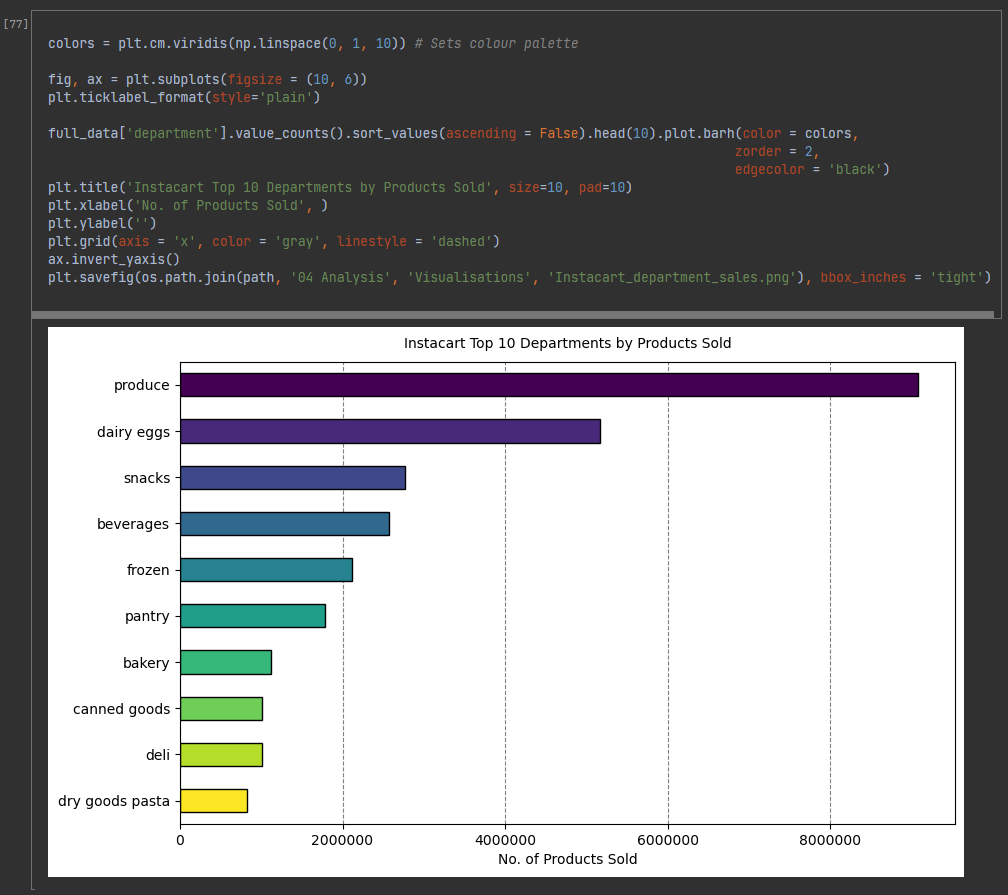
Bar chart created in Python showing top 10 departments by total products sold. Comparisons are easy to make given departments are in descending order and grid lines have been used. This chart formed the basis of similar charts using subplots to compare popular departments based on customer groups.
Reporting
To ensure my work was transparent and could be looked over by other analysts and/or colleagues, all steps in the data cleaning, data wrangling, and data merging phases were documented in Excel.
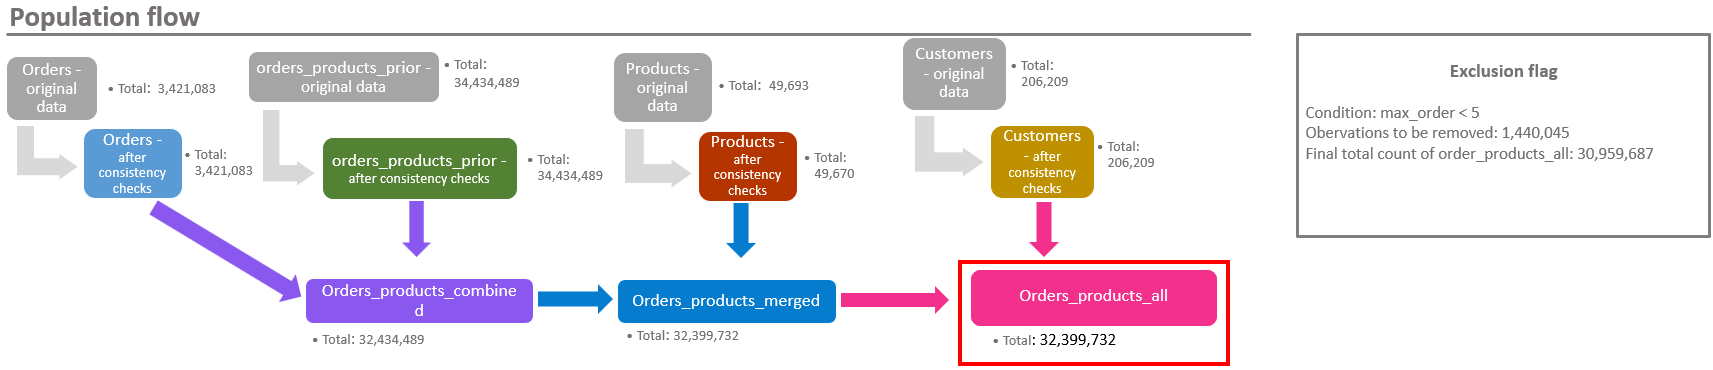
I also used and updated a population flow throughout the project for further transparency.
After numerous visualisations were constructed and refined in Python, charts and graphs were selected for use in the final report and to make recommendations to Instacart’s marketing, sales, and promotions teams.
Results and Deliverables
Summary of Results
Identified peak operational hours and days of the week to optimise ad scheduling.
Segmented customers based on loyalty status, region, age, and family status to help direct marketing efforts.
Identified most of Instacart’s customer base consists of customers who have made few purchases. Therefore, Instacart may entice these customers to shop more frequently with new loyalty programs (however, it is extremely difficult to assess if these are simply new customers due to the absence of datetime variables).
Deliverables
Jupyter Notebooks: All python code used throughout this project, documenting data cleaning, analysis, and visualisations.
Excel Report: File containing population flow, data cleaning and wrangling steps, key findings, Python visualisations, and recommendations for Instacart.